
Beyond the Average: Visualizing Extreme Water Quality Events
by Kate Dammann
My name is Katie Dammann, and I am going into my junior year at Oregon State University as an oceanography major. I have spent the last ten weeks working with the Gurr Lab to analyze and visualize extreme water quality events with a focus on hypoxia, acidification, warming, and freshening in Yaquina Bay as an intern in the OSU Branch Experiment Station internship program.
The data used for this project was archived from the Coastal Monitoring Station (CMS). Oregon State University (OSU) has maintained this small mooring in Yaquina Bay (Newport, Oregon) archiving water quality data since 1988. The current system at the CMS measures an array of seawater parameters in the Yaquina River Estuary including salinity, temperature, depth (tide), pH, and dissolved oxygen, taking measurements every fifteen minutes. This data tracks past, present, and future extremes driving mass mortality events of coastal fauna. This is vital in the current state where some of the causative agents of these events remain unknown.
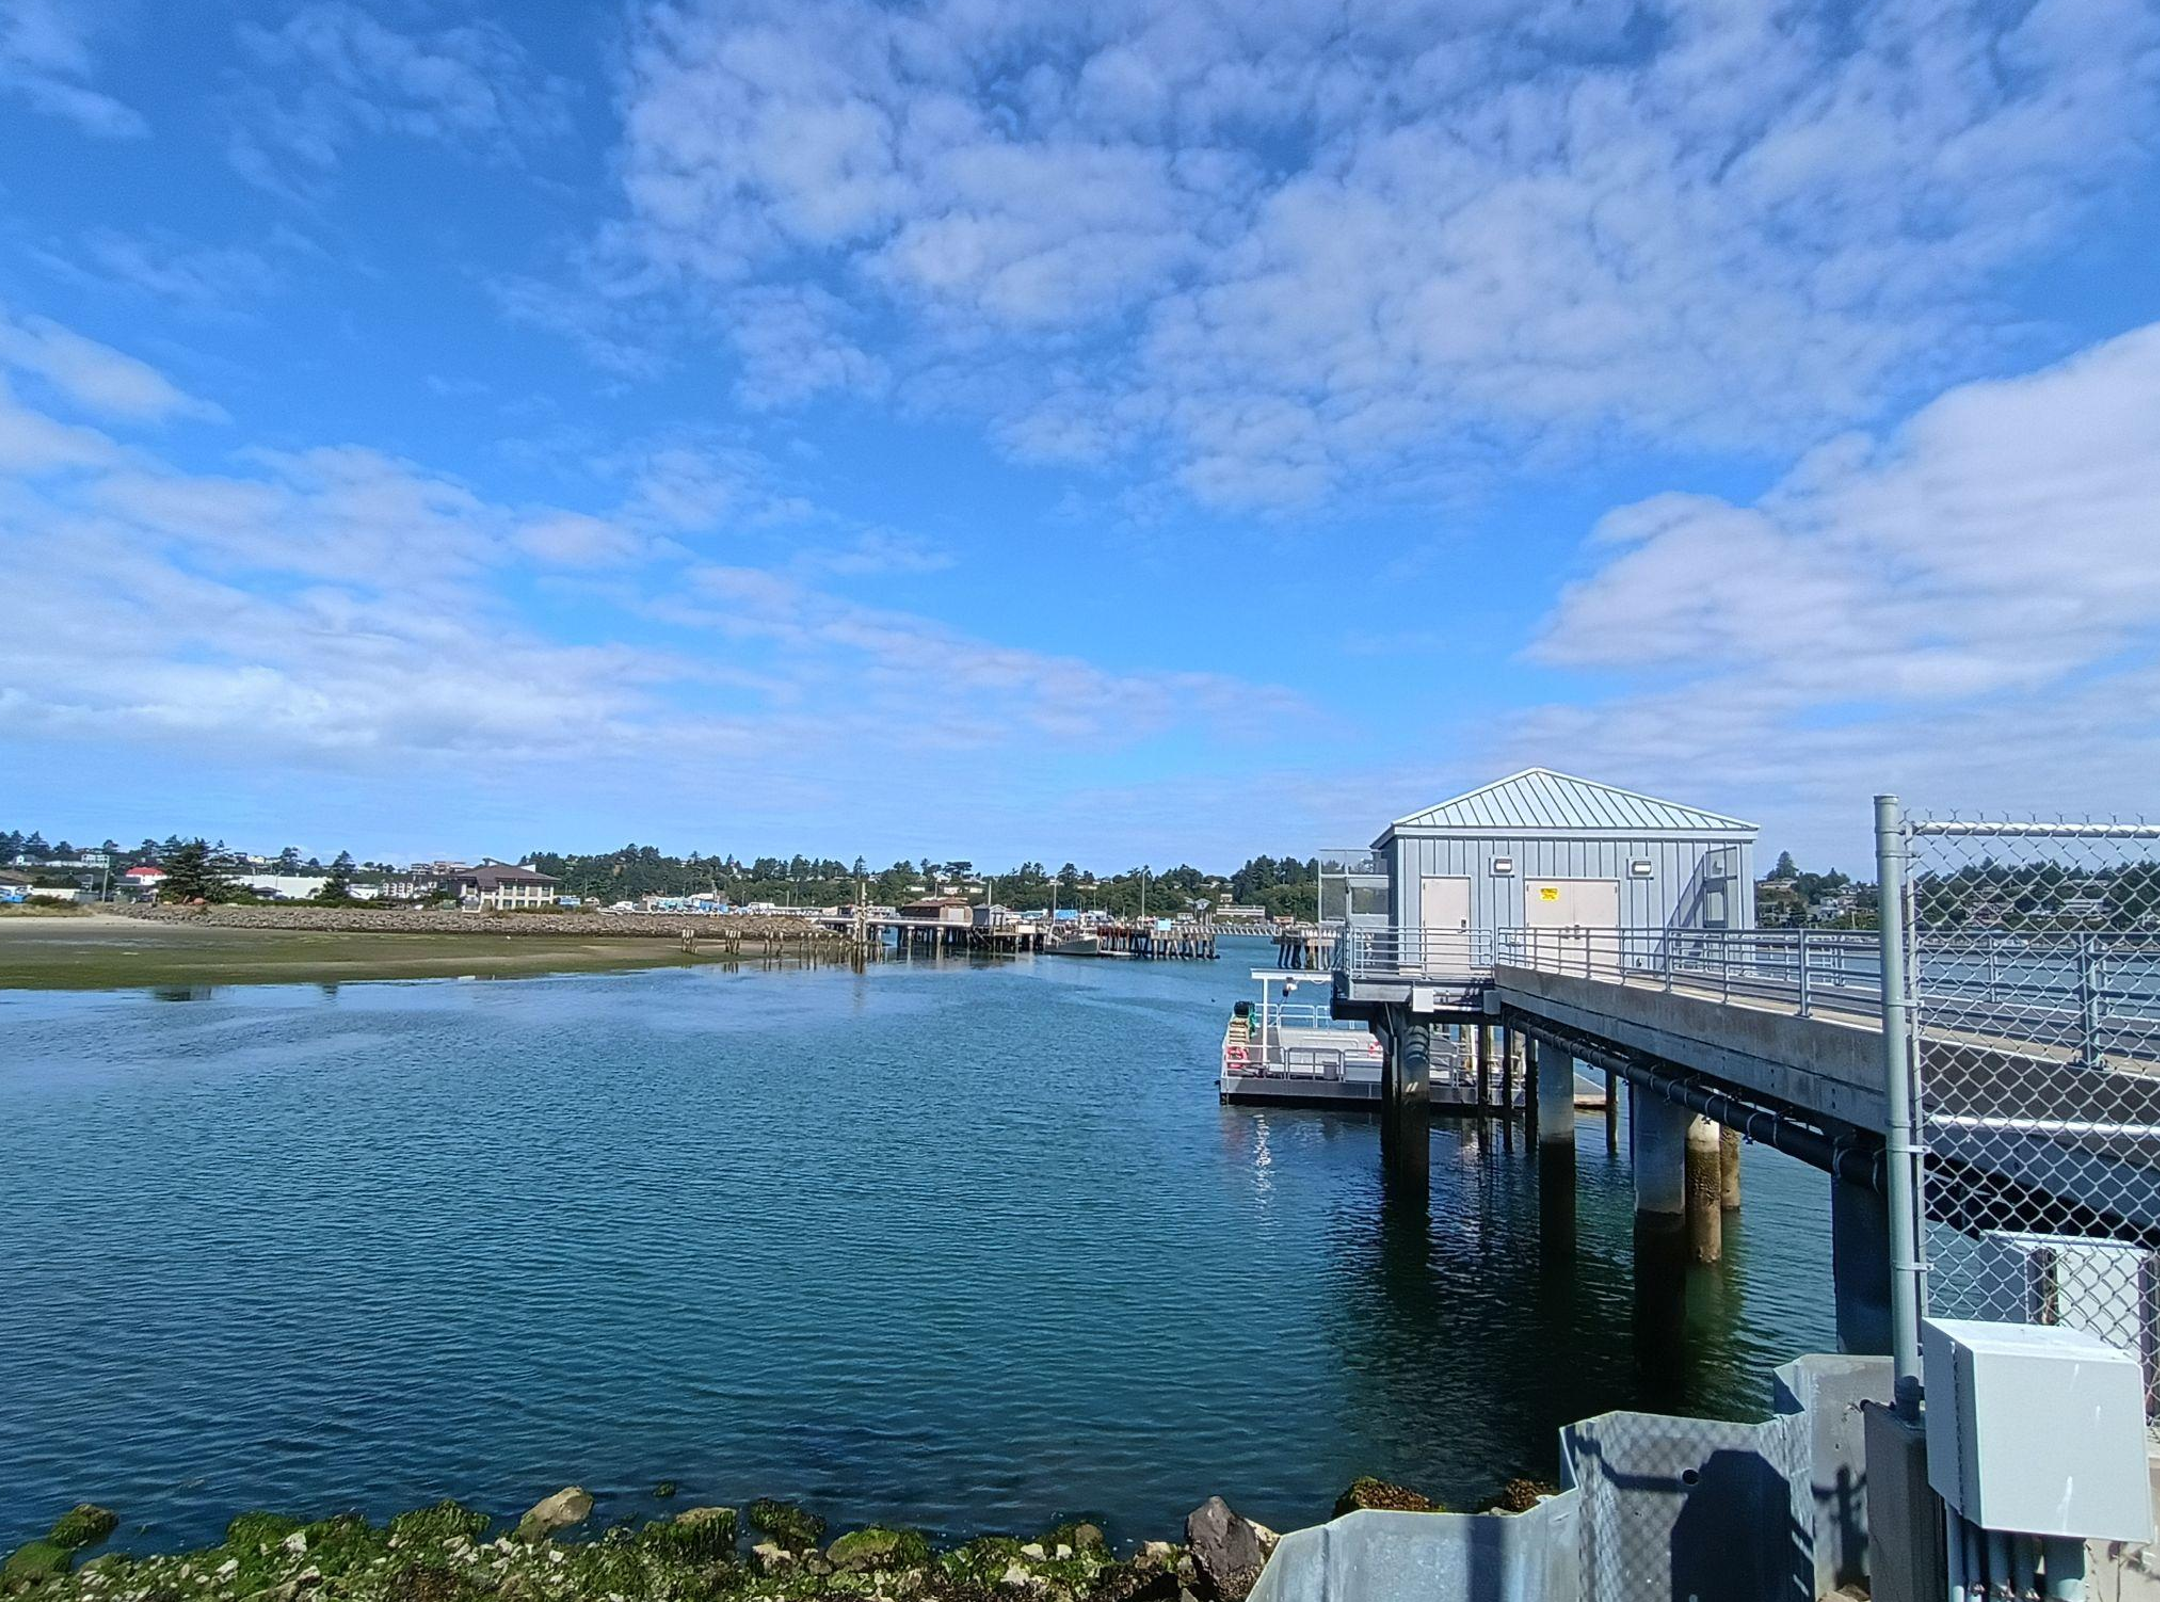
The Coastal Monitoring Station in Yaquina Bay Newport, Oregon. Photo credit: Kate Dammann
This mooring is located near the mouth of the Yaquina River Estuary, a critical habitat. Estuaries like the Yaquina River Estuary provide a sanctuary for breeding and serve as a nursery grounds for countless species. Estuaries stabilize shorelines, buffer from wave damage and flooding, and enhances water quality by filtering sediments, nutrients, and contaminants. Long-term monitoring systems such as the CMS are a critical scientific resource as they observe long-term trends, identify anomalous events, and track change through time. Data can be used in conjunction with and to enhance many other forms of marine research, aquaculture and coastal and estuarine management strategies, and give the knowledge for maintaining safe recreation areas.
My three goals for this project were to: 1) Compile archived data from the CMS to analyze water quality parameters from 2009-2025 looking at long-term trends and extreme stress events focusing on dissolved oxygen (hypoxia), pH (acidification), temperature (warming), and salinity (freshening). 2) Determine biological thresholds of coastal flora and fauna in response to extreme stress events through literature review. 3) Design a prototype for a public interface for users to interact with water quality data by selecting thresholds to isolate events.
I first dove into reading literature focusing on how extreme water conditions (hypoxia, ocean acidification, warming, and freshening) trigger stress responses for coastal fauna and flora. I was specifically looking for threshold values that would give me an idea across taxa. I quickly realized that this was a lot harder than I thought. Different species across many different taxa are impacted differently, and they each have different thresholds that elicit anything from a cellular stress response to fatality. The Oregon Department of Water Quality Standards (or other equivalent statutes) are very broad and usually only focus on fish species such as salmon or trout and sometimes other sensitive species. These species have different tolerances than oysters or crabs for example. It is important to research the specific species one is wanting to research, protect, or cultivate since thresholds are highly variable across various taxa and region.
From there, I worked with my mentor, Dr. Samuel Gurr to design and develop a user-friendly interface where one can access archived water quality data from the CMS and create plots looking at dissolved oxygen, pH, salinity, and temperature. Currently, one can toggle through inputs to select a parameter, time period, and threshold to set. The application will generate an interactive line graph and highlight events (at least an hour exceeding the defined threshold). A summary table summarizes the time period of events showcasing the frequency, mean duration, and mean magnitude (intensity). While the RShiny user interface is still in prototype form, the plan is to host it as a public resource soon. In future renditions of the website, we plan to include features such as the ability to access data from different locations, plot tides along with data, graph multiple parameters, isolate events and threshold values into bins, and the capacity to have downloadable plots and data.
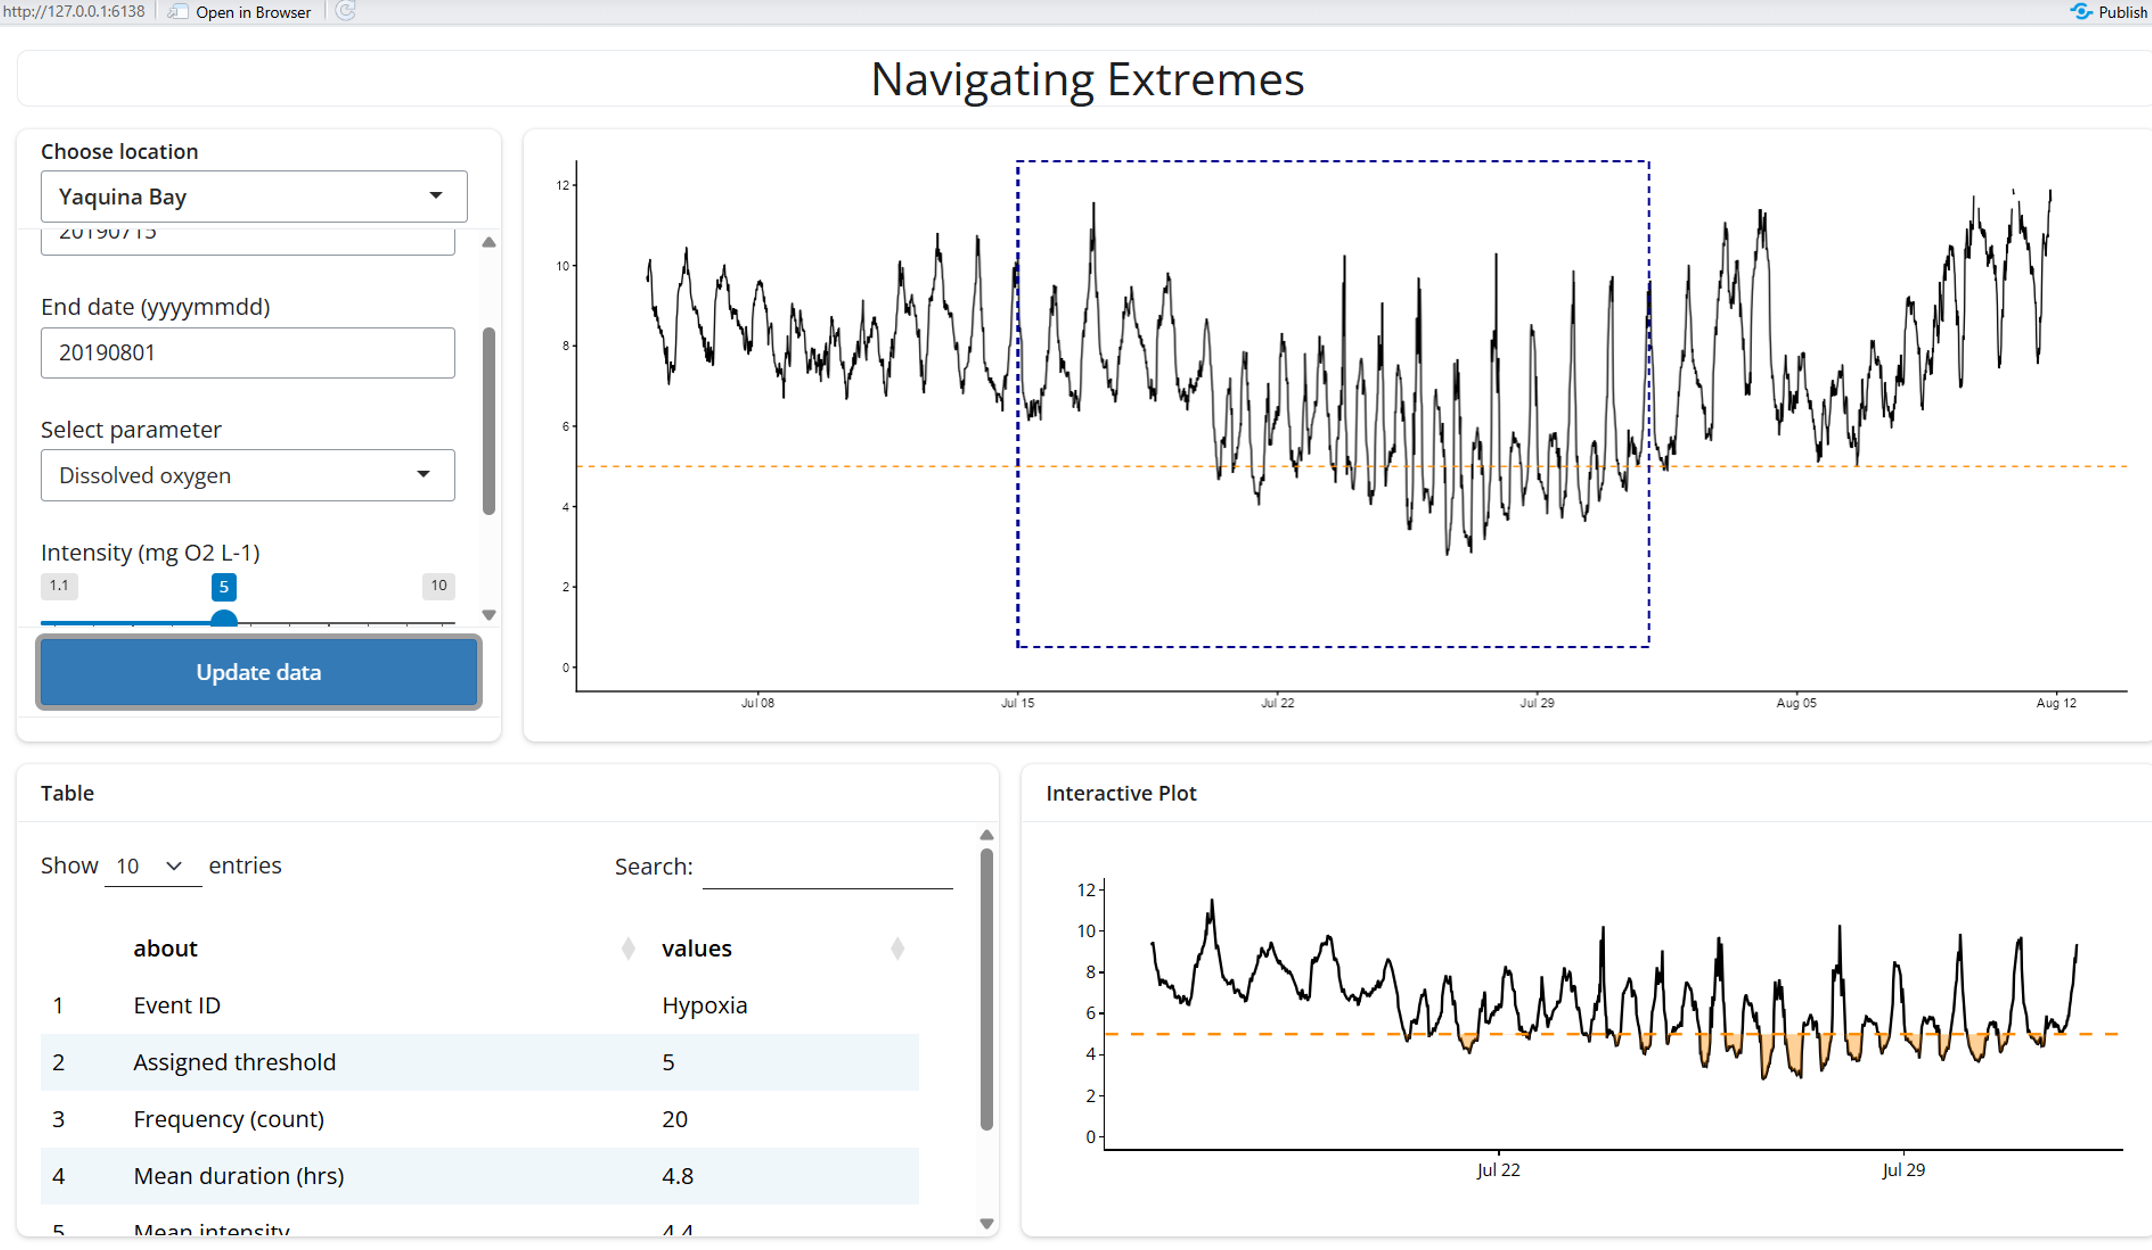
Screenshot of the Navigating Extremes RShiny server built by K. Dammann and S. Gurr in August 2026.
Finally, I used the RShiny website to analyze long-term trends of hypoxia from 2009-2025 < 5 mg/L. I went through the data month by month recording frequency, mean duration, mean magnitude, and lowest value of dissolved oxygen by month. Then, I created heatmaps using RStudio highlighting each variable over time. Because frequency, duration, and magnitude all play a role in the severity of a hypoxic event, I calculated (frequency x duration) / (magnitude) to get an arbitrary number that represents all three variables. This is the FDM value. The higher the number, the more severe the event was. I observed that the most severe hypoxic events occurred during the summer months with June and July having the most severe events.
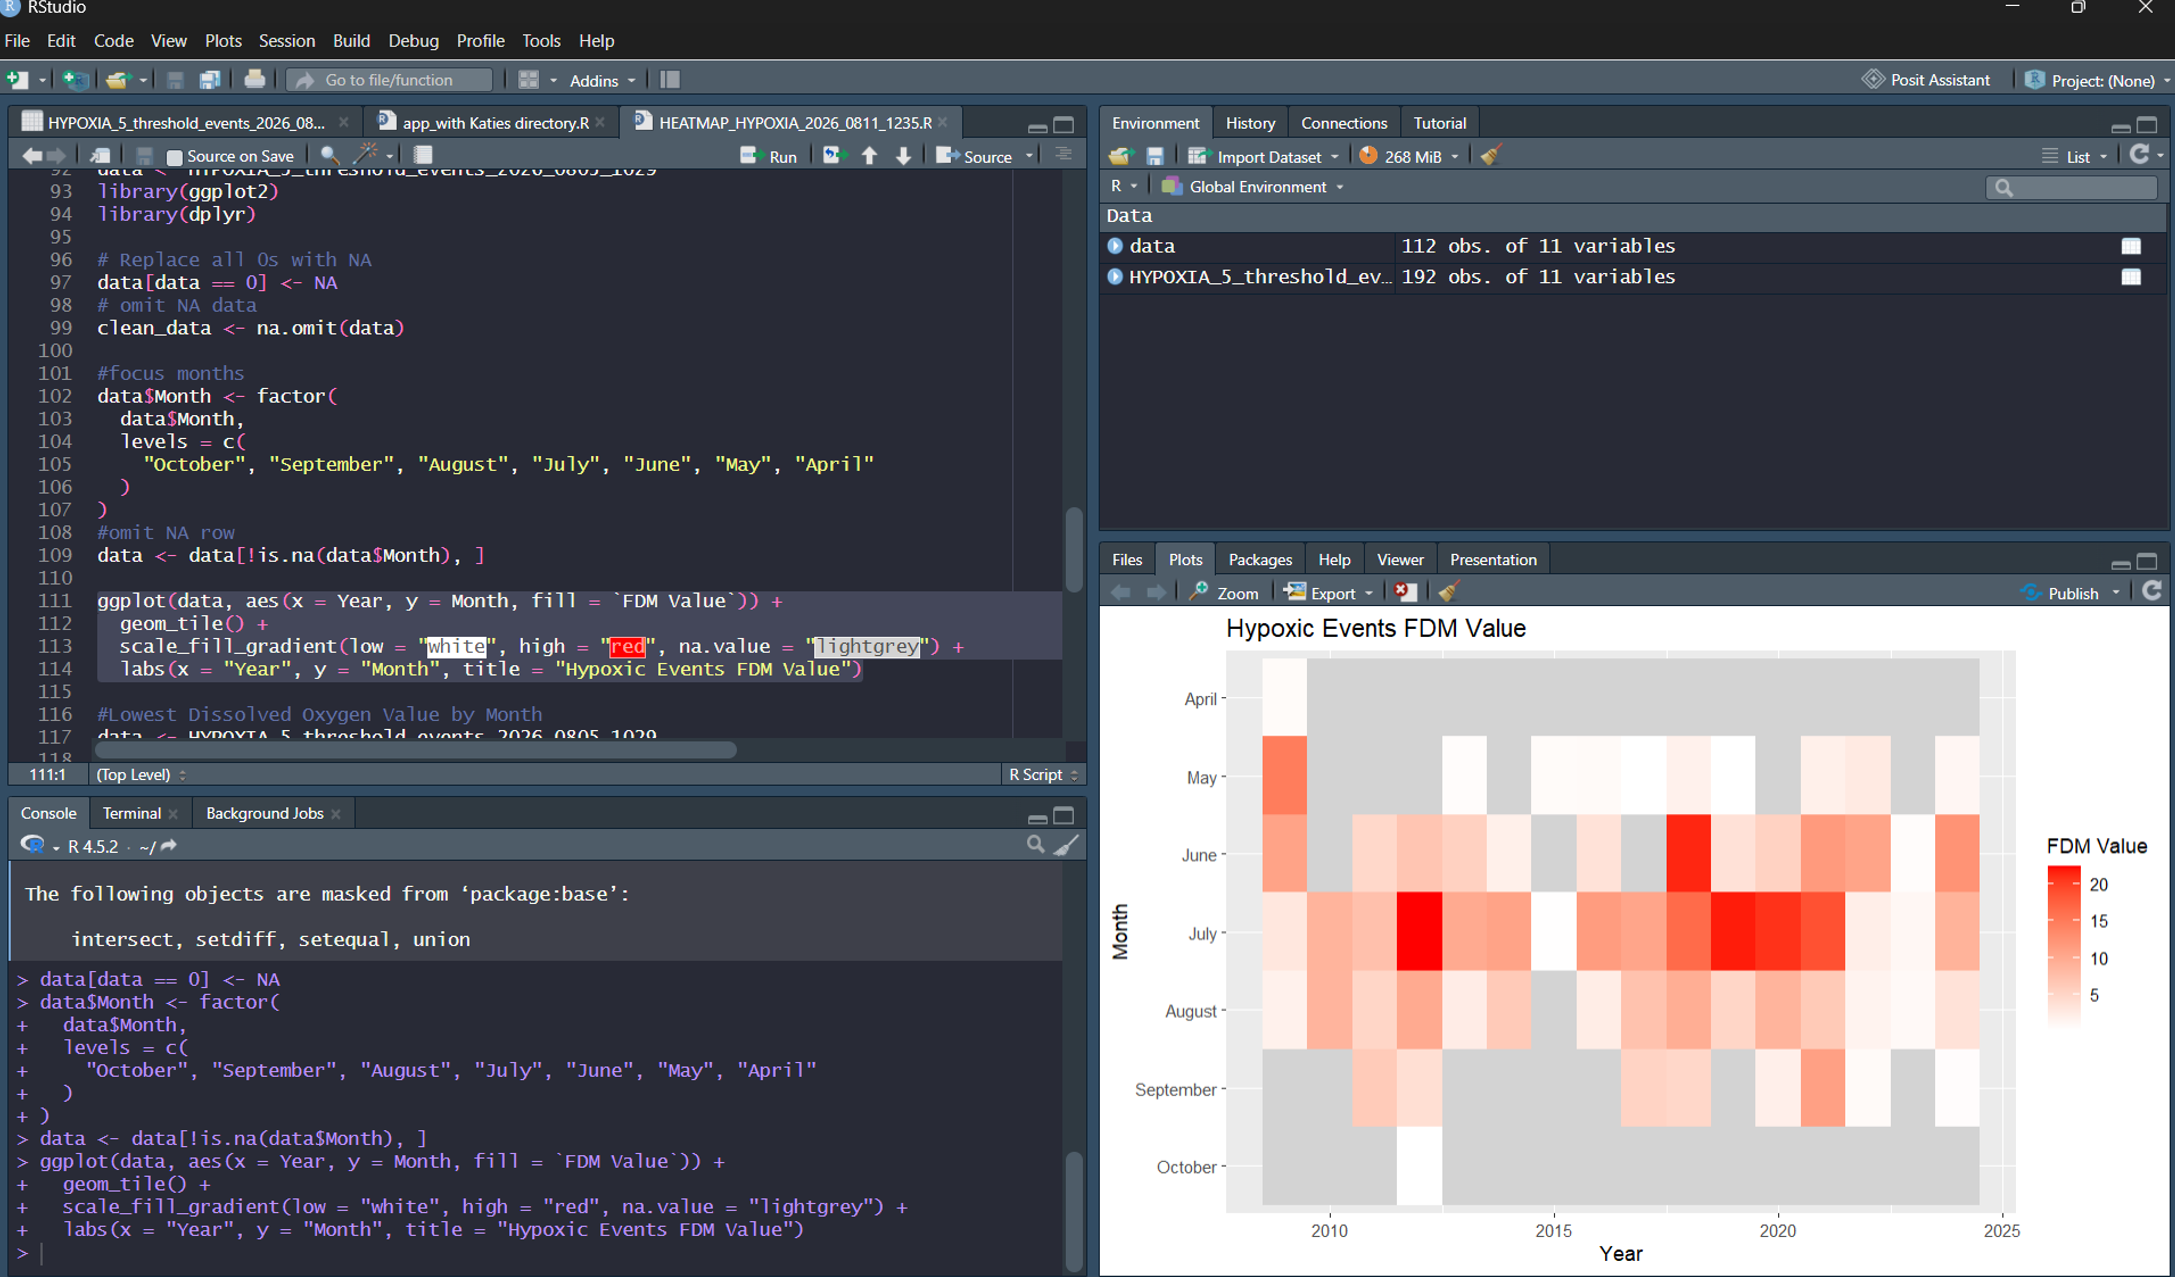
Screenshot of Kate’s R studio workspace to visualize heatmaps of hypoxic “event” descriptors output from Navigating Extremes RShiny.
The three takeaways from this project were thresholds are highly species dependent and vary by region, and hypoxic events in Yaquina Bay occur in the summer months coinciding with upwelling patterns. Finally, the RShiny User interface is still in the process of being developed, but the goal is to host it as a public resource soon to bridge the gap between scientific monitoring, the public, and aquaculture industry.
Overall, I learned how complex assigning biological thresholds can be because it is so variable by species and location. I also came into this internship with very little coding experience, so it was definitely a learning curve. Despite this, I was able to learn and accomplish so much, and I know that these are skills that will help me anywhere I go in my future career.
